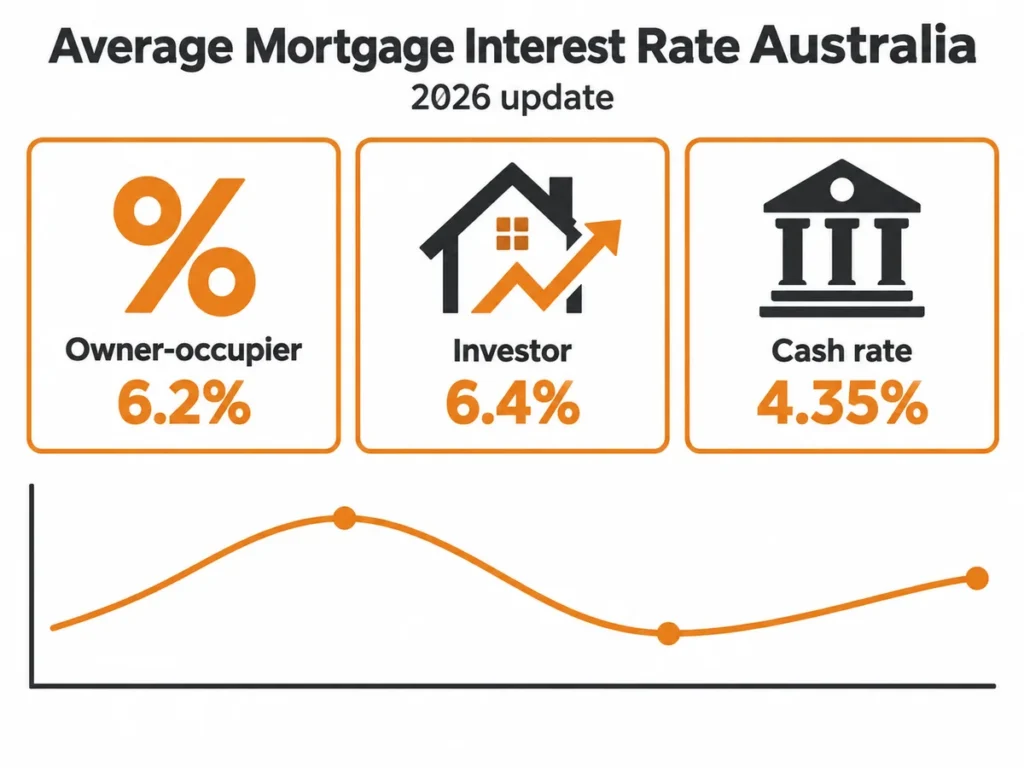
The average mortgage interest rate in Australia has moved a long way in two years. Borrowers who read the 2024 version of this guide saw the cash rate parked at 4.35% and average home loan rates above 6%. Since then the Reserve Bank of Australia (RBA) has cut three times, lifted three times, and landed back exactly where it started. This 2026 update sets out what the average owner-occupier and investor rate is right now, how it got here, and what the RBA has said about where it goes next, using the Reserve Bank’s own published data throughout.
In short: according to the RBA’s housing lending rate statistics for July 2026 (the latest month available at the time of writing), the average interest rate on outstanding owner-occupier home loans across all lenders is 6.2%, and the average on investment loans is 6.4%. The cash rate target is 4.35%, unchanged since 6 May 2026 and held again at the RBA’s 11 and 12 August meeting. The next cash rate decision is due on 29 September 2026.
What Is the Average Mortgage Interest Rate in Australia in 2026?
The most reliable measure of the average rate is the RBA’s Table F6, “Housing Lending Rates”, which reports the weighted average interest rate actually being paid on Australian home loans each month. It covers every lender that reports to APRA, both variable and fixed loans, and separates owner-occupier from investor lending. The figures below are for outstanding loans across all institutions, which is the broadest series available.
For owner-occupiers
The average interest rate on owner-occupier home loans was 6.2% in July 2026. That is up from a low of 5.5% between September 2025 and January 2026, and marginally above the 6.1% recorded in August 2024 when the previous version of this article was written. New owner-occupier loans funded in July 2026 also averaged 6.2%, so borrowers taking out a loan today are paying roughly the same as the existing book.
For investors
The average interest rate on investment home loans was 6.4% in July 2026, up from a low of 5.7% in December 2025 and January 2026. The gap between investor and owner-occupier pricing has narrowed slightly. In mid-2024 investors paid around 0.4 percentage points more than owner-occupiers; in July 2026 the difference is 0.2 points. New investment loans funded in July 2026 averaged 6.4%.

Source: RBA Table F6, housing lending rates, outstanding loans, all institutions. Figures are monthly weighted averages and are published to one decimal place.
How Rates Got Here: The Cash Rate Since 2024
Average home loan rates follow the RBA cash rate with a lag of one to two months, because lenders reprice variable loans after each decision and fixed loans only reprice when they roll off. The cash rate path since the last version of this guide explains almost all of the movement in the chart above.
| Decision date | Change | Cash rate target |
|---|---|---|
| November 2023 to January 2025 | Held | 4.35% |
| 19 February 2025 | -0.25 | 4.10% |
| 21 May 2025 | -0.25 | 3.85% |
| 13 August 2025 | -0.25 | 3.60% |
| October to December 2025 | Held | 3.60% |
| 4 February 2026 | +0.25 | 3.85% |
| 18 March 2026 | +0.25 | 4.10% |
| 6 May 2026 | +0.25 | 4.35% |
| 17 June and 12 August 2026 | Held | 4.35% |
Source: RBA cash rate target history, accessed 21 September 2026.
Three cuts through 2025 took the cash rate to 3.60% and the average owner-occupier rate to 5.5%. Three increases in the first half of 2026 reversed the entire easing cycle within four months. For a borrower on a variable rate, the practical effect was a 0.75 percentage point reduction that was then fully unwound. We cover what those 2026 moves have meant for Perth borrowers specifically in our guide to how RBA rate changes in 2026 are affecting Perth mortgage decisions.
Australia’s Interest Rate History
2019 to 2026
In July 2019, the earliest month in the RBA’s current lending rate series, the average owner-occupier rate was 3.84% and the average investor rate 4.31%. The pandemic response pushed both sharply lower. An emergency cut in March 2020 took the cash rate to 0.25%, followed by a further cut to 0.10% in November 2020, where it stayed until May 2022. Average owner-occupier rates bottomed at 2.6% in April 2022, the lowest point in the series.
The tightening cycle that followed was the fastest in a generation. From May 2022 to November 2023 the cash rate rose from 0.10% to 4.35% across 13 increases, and the average owner-occupier rate climbed from 2.6% to 5.9% by December 2023. Rates then plateaued through 2024, eased through 2025, and rose again in 2026 to the current 6.2%, which is the highest reading in the seven-year series.

Source: RBA Table F6, housing lending rates, outstanding loans, all institutions. This series covers all loan types (variable and fixed) and all reporting institutions.
1959 to 2026: the long view
For anything earlier than 2019 the RBA’s longest-running measure is the banks’ standard variable rate for owner-occupiers (Table F5), which goes back to January 1959. It is a headline rate rather than the rate most borrowers actually pay, because lenders discount from it, but it is the only series that lets you compare today’s environment with the 1980s or the 1990s.
On that measure, today’s rates are unremarkable by historical standards. The standard variable rate peaked at 17.0% in June 1989 and was still above 10% in mid-1995. It fell below 8% for most of the 2010s, hit a record low of 4.52% in March 2020, eased to 8.02% during the 2025 cutting cycle, and has been back at 8.77% since May 2026, the same level as in late 2023. The decade from 2009 to 2020 ranged between 4.52% and 7.79%, which now looks like the exception rather than the rule.

Source: RBA Table F5, indicator lending rates, banks’ standard variable rate for owner-occupiers. Standard variable rates are advertised reference rates; most borrowers pay a discounted rate below this figure.
Where Could Interest Rates Go From Here?
Nobody can say with confidence where the cash rate will be in twelve months, and this article does not attempt to forecast it. What can be said is what the RBA itself has published. In holding the cash rate at 4.35% on 12 August 2026, the Monetary Policy Board said headline inflation was still too high and that financial conditions had already tightened in response to the three increases earlier in the year. It also observed that momentum in the housing market had shifted, with prices falling in some capital cities and new housing lending declining. The decision was unanimous. The Board meets eight times a year; the remaining 2026 meetings are on 28 and 29 September, 2 and 3 November, and 7 and 8 December.
Two features of the current environment are worth understanding regardless of the direction of the next move:
- Lenders do not always pass on the full change. The average owner-occupier rate fell 0.6 percentage points across the 2025 cuts (from 6.1% to 5.5%) against a 0.75 point fall in the cash rate, and rose 0.7 points across the 2026 increases. Your own rate depends on your lender’s decision each time, not only the RBA’s.
- Fixed rates move before the RBA does. Fixed-rate pricing reflects where the market expects the cash rate to be over the fixed term, so it often changes weeks ahead of a decision. If you are weighing up fixing, our guide to fixed versus variable rates in Perth explains the trade-offs in general terms.
What the Average Means for Your Own Loan
The average is a useful benchmark, not a target. It blends every loan in the country, including older fixed loans, small lenders, large loans with deep discounts and small loans with none. A borrower with a low loan-to-value ratio and a clean repayment history may be offered a rate below the average; a borrower with a high LVR, an interest-only investment loan or a loan with a lender who has not repriced recently may be above it.
If your current rate is noticeably above the 6.2% owner-occupier or 6.4% investor averages, that is a reasonable prompt to ask why. Our article on five signs your home loan rate may be costing you money lists the common reasons, and our guide to how a broad-panel mortgage broker compares rates explains how rate comparison across lenders works in practice.
Frequently Asked Questions
What is the average home loan interest rate in Australia right now?
According to the RBA’s July 2026 data, the average rate on outstanding owner-occupier home loans is 6.2% and on investment loans 6.4%. These are weighted averages across all lenders and all loan types. The RBA updates Table F6 monthly, usually in the first week of the following month.
What is the RBA cash rate today?
The cash rate target is 4.35%. It was raised to that level on 6 May 2026 and held at the June and August 2026 meetings. The next decision is scheduled for 29 September 2026.
Are interest rates high compared with history?
Compared with the 2010s, yes. Compared with the full record since 1959, no. The banks’ standard variable rate is currently 8.77%; it exceeded 10% for most of the period from 1974 to 1996 and peaked at 17.0% in 1989. The record low was 4.52% in March 2020.
Why is the average investor rate higher than the owner-occupier rate?
Since 2015 lenders have generally priced investment loans above owner-occupier loans, partly in response to regulatory measures that treated investor lending as higher risk. The gap has varied between roughly 0.2 and 0.5 percentage points and currently sits at 0.2 points.
Where does the data in this article come from?
All rate figures are from the Reserve Bank of Australia’s published statistical tables: Table F6 (housing lending rates) for average owner-occupier and investor rates, Table F5 (indicator lending rates) for the long-run standard variable rate, and the RBA’s cash rate target history. Figures were accessed on 21 September 2026 and reflect data to July 2026 for lending rates and August 2026 for the standard variable rate.
Want to Know How Your Rate Compares?
If you would like to understand how your current loan sits against the market, our Perth brokers can review your loan and compare it across our lender panel. Read about refinancing with Strategic Mortgages Perth, learn about our investment property lending, or book a free, no-obligation chat.
Data sources: RBA cash rate target; RBA statistical tables F5 and F6; RBA board meeting schedule.
Disclaimer: The information provided in this article is general in nature and does not constitute financial, tax, or legal advice. Individual circumstances vary. Interest rate figures are averages published by the Reserve Bank of Australia, current as at 21 September 2026, and are subject to change. Your own rate will depend on your lender, loan type and circumstances. We recommend consulting with qualified professionals before making financial decisions.